Peter Stempel
- Associate Professor of Landscape Architecture
-
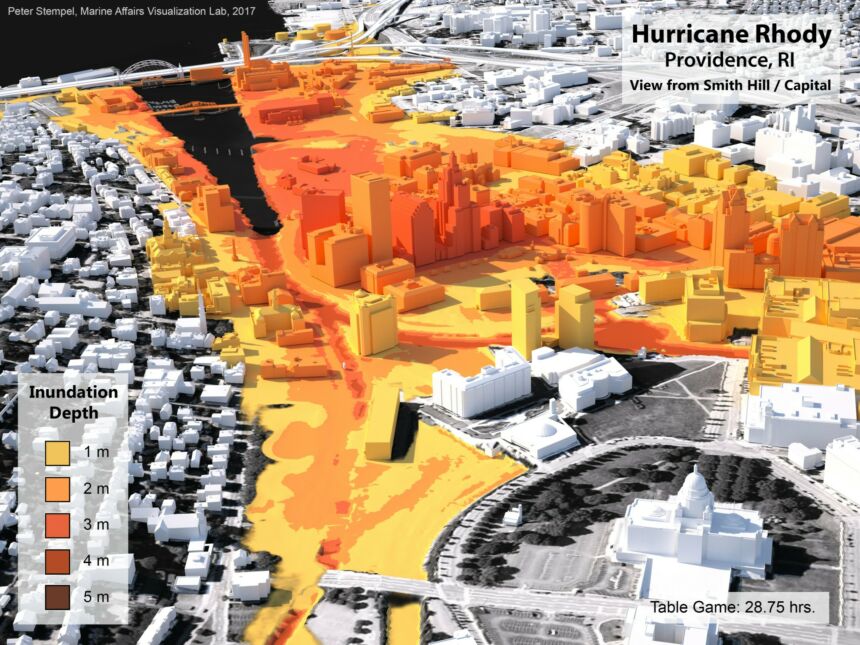
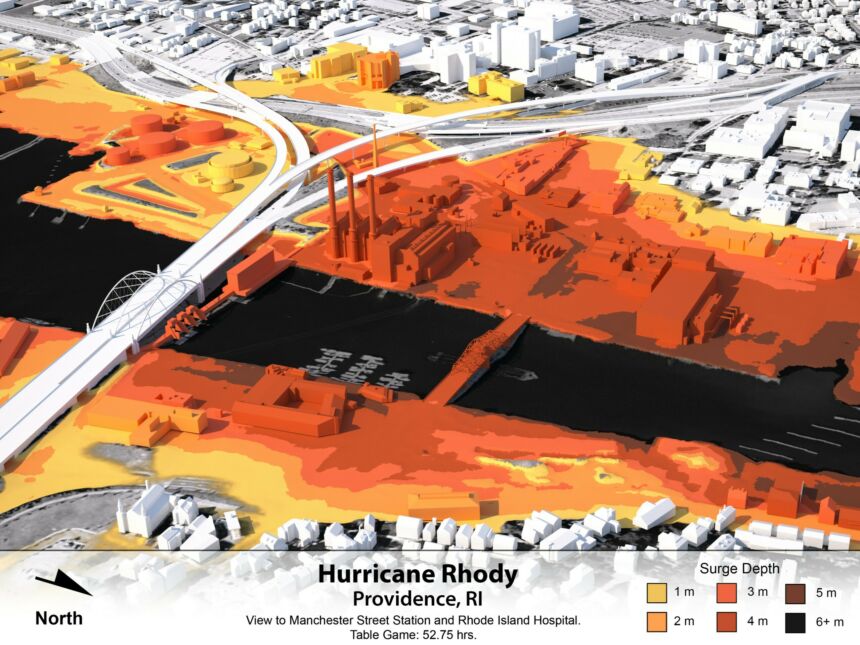
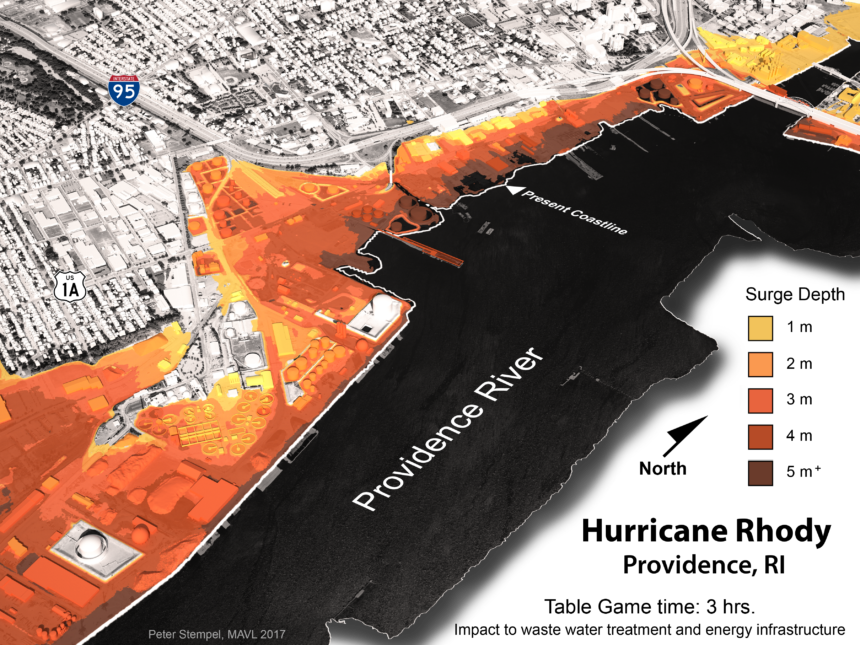
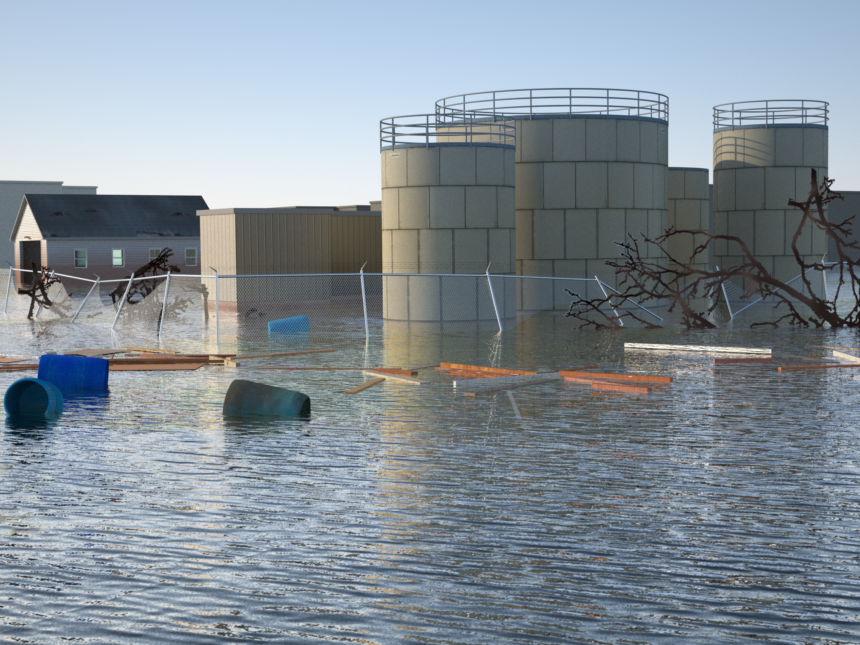
Coastal Resilience
-
Hazard and Risk Communication
-
Visualization
-
Visual Rhetoric
-
Science Communication
324 Stuckeman
- Email pjs6035@psu.edu

Biography
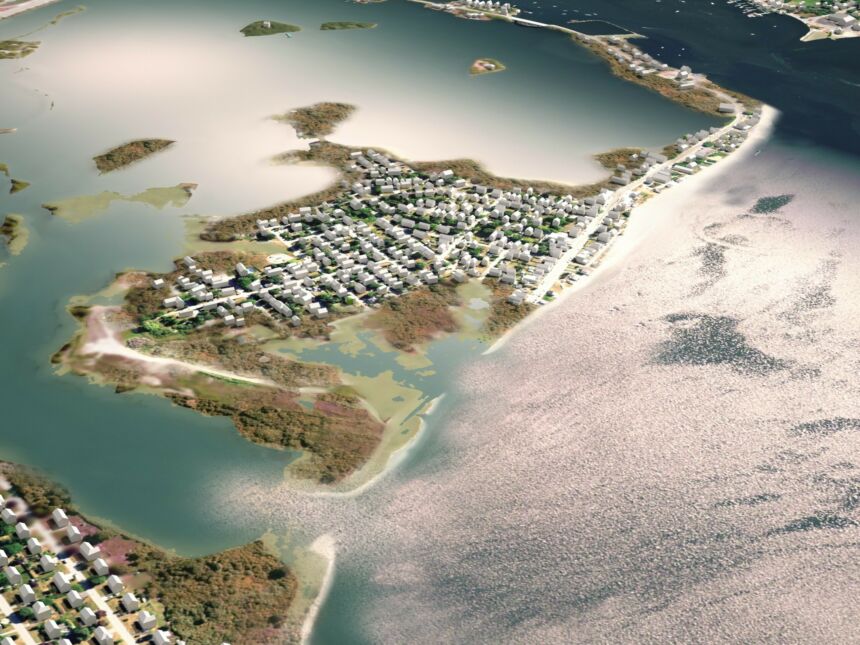
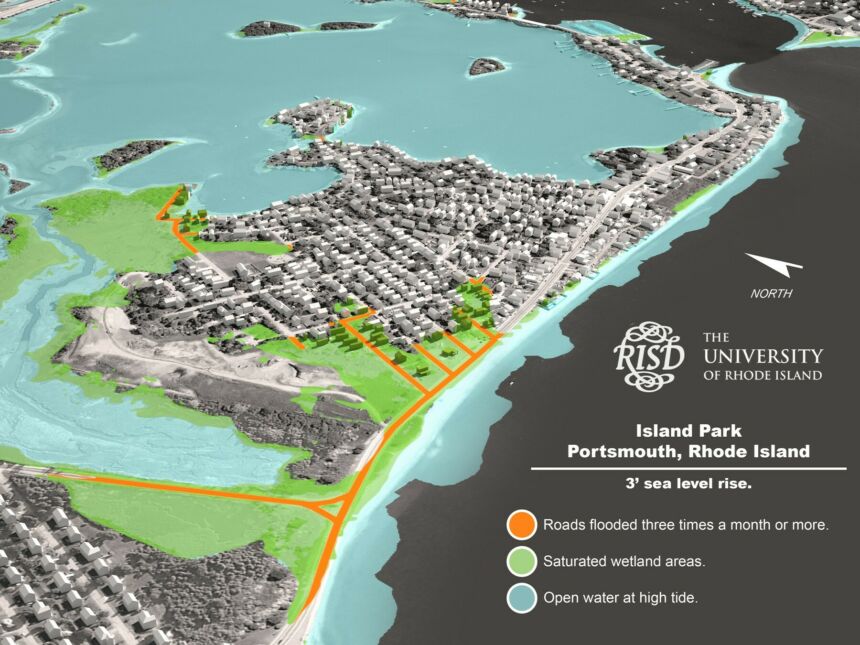
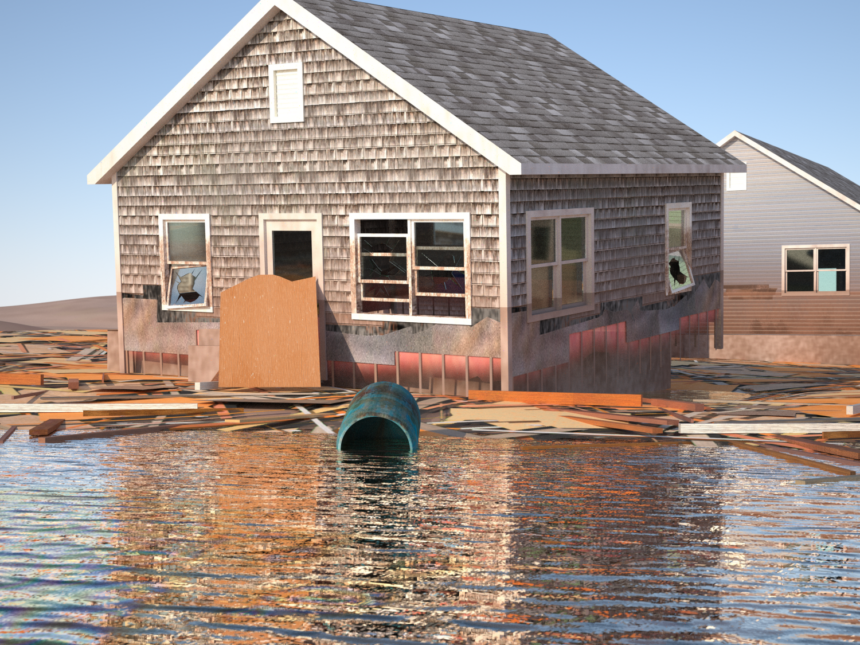
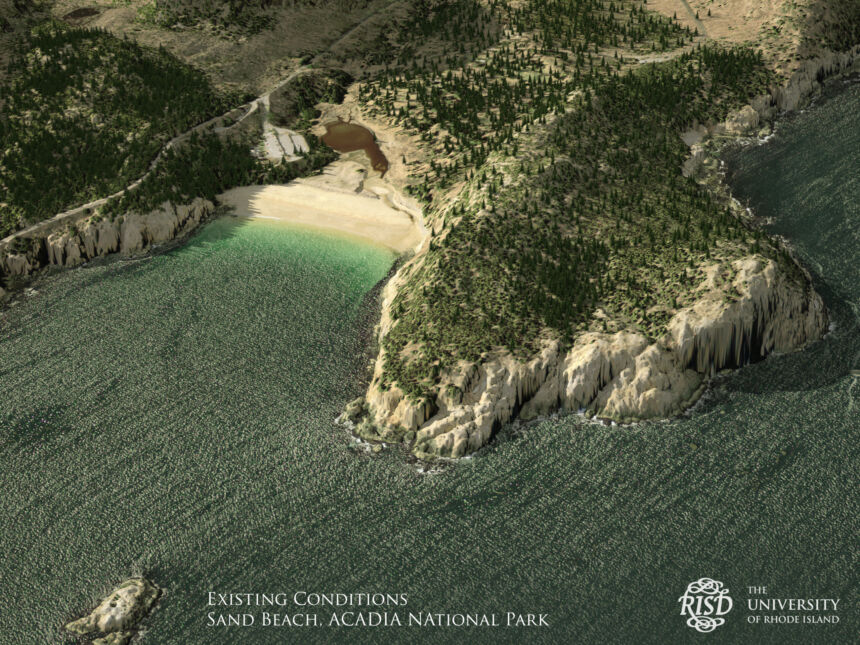
Peter Stempel is an associate professor in the Department of Landscape Architecture and is affiliated with the Penn State Institutes of Energy and the Environment, Water Faculty Initiative, and the Ecology Plus Design: E+D initiative. His research is focused on realizing the transformative potential of realistic visualization for hazard and risk communication and public engagement. His work links physical models such as hydrodynamic and wind models to qualitative data gathered from stakeholders and visualizations. He is part of interdisciplinary teams working on projects for the National Park Service and the U.S. Department of Homeland Security Center of Excellence for Coastal Resilience. This applied work is complimented by social science research designed to improve visualization practices and inform the development of new paradigms for the use of realistic visualizations.
Stempel’s multi-domain expertise builds on a diverse career as a sculptor, architect, activist, and non-profit leader conducting public engagement. He spent most of his career working in the rural southwest United States prior to pursuing a Ph.D. in Marine Affairs at the University of Rhode Island. He draws on these broad experiences to inform his teaching. He is developing inclusive curriculum in water-related resilience and training designers to collaborate more effectively with scientists, policymakers, and stakeholders to equitably address complex societal issues like climate adaptation. Stempel has over 25 years of design teaching experience and is committed to applying innovative asset-based pedagogies that recognize and build on the unique skills and abilities of every student.
Collected Works